|
|

|
Automatic angle/radius measurements Full profile of roll groove Automatic roll height, length and depth Manual angle, distance and radii testing AutoCAD interface Compare profiles with original diagrams |
| Roll
profiling - who needs it?
Much attention has justifiably been given to quality control of the seaming process. Can-makers and can-fillers are routinely checking their seam quality. A weak point in this process is the quality inspection of rolls and chucks. Rolls and chucks are automatically accepted in nice boxes, but lacking quality check documentation. These same rolls are assembled on the seaming machine, but without any confidence that they meet their required specification! It is important to note that ISO 9000 requires all production phases be tested. New rolls and chucks, going into a seamer, are the most basic components of "manufacturing" the seam. As such, each set of rolls and chuck need to be tested before installation. This task can be done by the can maker or filler, or by the roll manufacturer - who will then need to produce a certificate, showing the exact values of that particular roll or chuck. Often, however, this task is deferred due
to the complexity of profiling and testing the roll. The values for testing
a roll or chuck are not as simple as those in a seam; There are often multiple
radii (radiuses) and angles, as well as distances - which all need to be
exact in order for the correct seam to be produced.
|
|
| Other
types of systems
Techniques for measuring the roll groove profile are somewhat problematic. The groove is small (often less than 5mm in width), has steep angles (i.e., angles approaching 90 degrees) and is difficult to approach. Current techniques
for inspecting rolls are:
The slow and inaccurate nature of these systems for use with rolls prohibits their widespread use for measuring them. 2. Non-contact projection system. Such systems are fairly popular. Their cost is somewhat less than the contour meter and they essentially magnify a shadow graph image of the roll. This graph has to be traced by hand, onto paper. This transfer is both inaccurate and very time consuming. In addition, a hand drawn graph (although more accurate than the contour meter) cannot be used as an ISO 9000 certified document. This technique has no problem with vertical slopes. |
|
| inROLL
9000
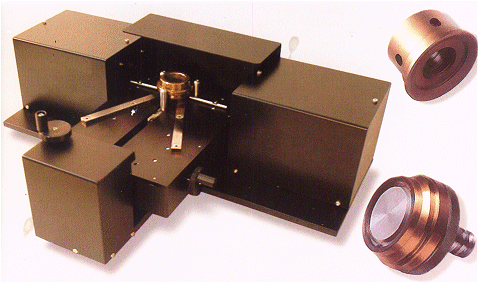
inROLL 9000 utilizes advances in laser technology, computer imaging and the latest innovations in software. The system utilizes lasers in order to produce a high quality profile image which can be digitized and analyzed by the software. The operator can then analyze the image, compare it with existing profiles, measure angles & radii automatically or manually as well as manually measure distances. Automatically generated measurements can be included in reports and analyzed for consistancy (e.g., differences between heads or manufacturer). The operator can
compare profiles with previously generated profiles, or with bitmap images
generated by other software, such as AUTOCAD®
|
|
Specifications
| Distance from roll bottom
to groove 5Omm
(custom distances upon request) |
5mm calibration resolution |
| Roll/Chuck diameter 45-175mm
(custom diameters upon request) |
Calibration gauge (NAMAS optional) |
| 8.5mm resolution scan | Interfaces with AutoCAD® |
| High angle measurements (89 degrees) | Prints profiles at 50:1 scale (variable) |
| Auto radius/angle measurements | Compare profiles with bitmap files |
| Windows 9X/NT application | Profile and report database |
| Multilingual | Automatic angle/radius measure |
| Manual distance/angle/radius measurement |
| Acceptance
testing
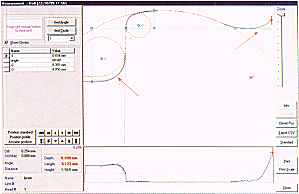
When receiving rolls or chucks from an existing, or new supplier - it is recommended to verify that the rolls are precisely the same as known good rolls. Any new parts going into the seamer (particularly those as important as rolls or chucks) should be inspected before they are installed! As the image shows, there are often major differences between rolls produced by two different manufacturers, using the same original diagram as a specification! The red arrows were added to show the areas with the most differences between the rolls. |
 |
| Quality
Control
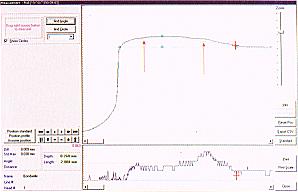
It is often important to know how corrosion and high usage effect the profile. In some instances a small change in roll design may improve durability. The effect of wear and tear can be shown in this image, where the green profile is brand new and the blue profile shows the same roll after producing approximately 40 million cans. The red arrows were added to show areas where corrosion has effected the roll profile the most. |
 |